Common DOM Performance Issues and How to Fix Them
Modern websites are expected to feel fast, smooth, and responsive. Users no longer tolerate laggy interfaces, delayed interactions, or pages that freeze during scrolling. While developers often focus on server optimization and JavaScript frameworks, one critical factor is frequently overlooked: DOM performance.
A poorly optimized DOM can slow down even powerful applications. Excessive re-rendering, unnecessary elements, and inefficient manipulation techniques can dramatically impact user experience.
The good news is that most DOM performance problems are fixable once you understand what causes them.
This guide explains the most common DOM performance issues developers face and how to fix them effectively, using practical examples and real-world optimization strategies.
What is DOM Performance?
The DOM (Document Object Model) is the browser’s representation of your HTML structure.
Every HTML element becomes a node in the DOM tree:
<div class="card"> <h2>Title</h2> <p>Description</p> </div>
The browser must:
- Parse HTML
- Build the DOM tree
- Apply CSS
- Render content
- Update the UI when changes occur
The larger and more frequently updated the DOM becomes, the harder the browser has to work.
Why DOM Performance Matters
Poor DOM performance can cause:
- Slow page rendering
- Laggy animations
- Delayed user interactions
- High memory usage
- Bad Core Web Vitals scores
This affects:
- User experience
- SEO rankings
- Conversion rates
Even small inefficiencies become noticeable in large applications.
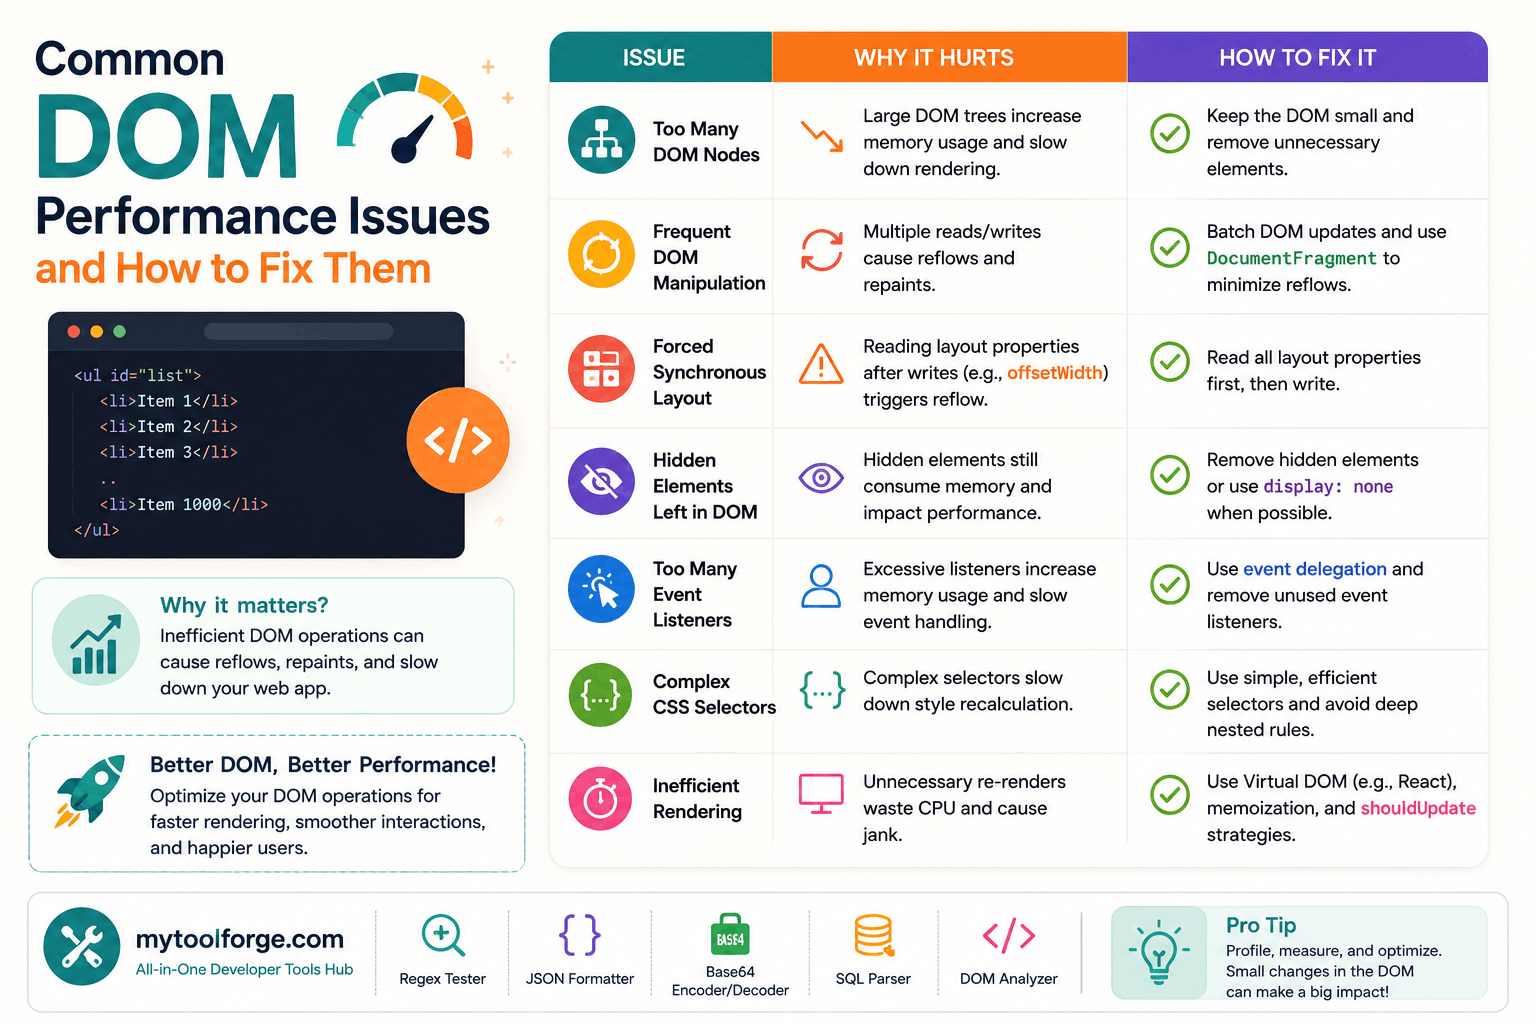
1. Excessive DOM Size
One of the most common performance problems is having too many DOM elements.
Problem Example
<ul> <li>Item 1</li> <li>Item 2</li> <li>Item 3</li> ... </ul>
Large pages with thousands of nodes increase:
- Memory usage
- Rendering cost
- Layout calculation time
How to Fix It
Remove Unnecessary Wrappers
Bad:
<div> <div> <div> <p>Content</p> </div> </div> </div>
Better:
<div> <p>Content</p> </div>
Use Virtualization
For large lists:
- Render only visible items
- Load more content dynamically
This is especially useful for:
- Tables
- Infinite scrolling
- Dashboards
2. Frequent DOM Manipulations
Every DOM update can trigger rendering work.
Problem Example
for (let i = 0; i < 1000; i++) { document.body.innerHTML += `<p>${i}</p>`; }
This repeatedly forces the browser to update the DOM.
How to Fix It
Batch Updates
Better approach:
let html = ""; for (let i = 0; i < 1000; i++) { html += `<p>${i}</p>`; } document.body.innerHTML = html;
This reduces unnecessary re-rendering.
3. Layout Thrashing
Layout thrashing occurs when JavaScript repeatedly reads and writes layout-related properties.
Problem Example
element.style.width = "100px"; console.log(element.offsetWidth); element.style.width = "200px";
The browser constantly recalculates layout.
How to Fix It
Group reads and writes separately.
Better:
const width = element.offsetWidth; element.style.width = "200px";
4. Inefficient Event Listeners
Attaching too many listeners hurts performance.
Problem Example
buttons.forEach(button => { button.addEventListener("click", handleClick); });
If hundreds of buttons exist, this becomes inefficient.
How to Fix It
Use event delegation.
Better:
document.body.addEventListener("click", (e) => { if (e.target.matches(".btn")) { handleClick(); } });
This reduces memory usage significantly.
5. Forced Reflows and Repaints
The browser recalculates layout whenever certain properties change.
Triggers include:
- Width
- Height
- Margin
- Font size
Frequent changes create performance bottlenecks.
How to Fix It
Prefer GPU-accelerated properties like:
- transform
- opacity
Example:
transform: translateX(100px);
instead of:
left: 100px;
6. Heavy Animations
Complex animations can overload the rendering engine.
Problem:
Animating large DOM sections continuously.
How to Fix It
Use:
- CSS animations
- requestAnimationFrame()
- Hardware-accelerated properties
7. Memory Leaks from Detached Nodes
Detached nodes remain in memory even after removal.
Problem Example
const element = document.getElementById("card"); element.remove();
If references still exist, memory isn’t released.
How to Fix It
Remove unused references:
element = null;
8. Inefficient Selectors
Complex selectors slow DOM queries.
Slow:
document.querySelector("div.container ul li span");
Faster:
document.getElementById("target");
9. Rendering Hidden Elements
Hidden elements still consume memory.
Problem:
Large hidden modals or sections loaded unnecessarily.
How to Fix It
Use:
- Lazy loading
- Conditional rendering
Render only when needed.
10. Excessive Re-rendering in Frameworks
React, Vue, and other frameworks can trigger unnecessary updates.
Common Causes:
- State updates too frequently
- Poor component structure
How to Fix It
Use:
- Memoization
- Component splitting
- Optimized state management
How Browsers Render the DOM
Understanding rendering helps diagnose issues.
Browser Rendering Pipeline:
- Parse HTML
- Build DOM tree
- Apply CSS
- Create render tree
- Layout calculation
- Paint pixels on screen
Any DOM change may trigger parts of this process again.
How to Analyze DOM Performance
Use browser DevTools.
Key tabs:
- Performance
- Memory
- Lighthouse
Look for:
- Long rendering tasks
- Excessive reflows
- Heavy scripting
Real-World Example
Imagine an e-commerce page with:
- Thousands of products
- Heavy filtering
- Dynamic rendering
Without optimization:
- Scrolling becomes laggy
- Input feels delayed
Solutions:
- Virtual scrolling
- Lazy loading
- Efficient updates
Best Practices for DOM Optimization
Keep DOM Small
Avoid unnecessary elements.
Minimize Reflows
Batch updates when possible.
Use Efficient Selectors
Prefer IDs and simple classes.
Optimize Animations
Use transforms instead of layout-changing properties.
Avoid Constant Re-rendering
Especially in frameworks.
Common Mistakes Developers Make
- Overusing nested elements
- Manipulating DOM repeatedly in loops
- Ignoring browser rendering costs
- Attaching unnecessary event listeners
Pro Tips for Faster Frontend Performance
- Cache DOM references
- Use document fragments for bulk inserts
- Debounce expensive events like scroll/resize
- Audit performance regularly
Why DOM Performance Impacts SEO
Google measures user experience signals like:
- Largest Contentful Paint (LCP)
- Interaction to Next Paint (INP)
- Cumulative Layout Shift (CLS)
A slow DOM negatively affects these metrics.
That means DOM optimization is not just about speed—it also impacts search rankings.
Final Thoughts
DOM performance issues often grow silently as applications become more complex. A page may work fine initially, then gradually become sluggish as more components, animations, and interactions are added.
The key is understanding how the browser handles rendering and avoiding unnecessary work.
When you:
- Reduce DOM size
- Minimize reflows
- Optimize updates
- Use efficient rendering strategies
Your applications become noticeably faster and smoother.
Try Next
Other utilities you might find helpful
Regex Tester
Test and debug regular expressions with live matches.
Regex Debugger
Understand regex step-by-step with explanations.
JSON Formatter
Format, validate, and minify JSON instantly.
Base64 Encoder/Decoder
Encode and decode Base64 strings and files.
SQL Explain Parser
Analyze SQL execution plans and optimize queries.
DOM Complexity Analyzer
Analyze HTML DOM structure, detect deep nesting, count nodes, and identify performance issues instantly.