Web Debugging Workflow for Frontend Developers
Frontend development has evolved significantly over the past decade. Modern applications rely on complex JavaScript frameworks, third-party APIs, asynchronous operations, responsive layouts, and sophisticated state management systems. While these technologies improve user experiences, they also increase the likelihood of bugs, performance issues, rendering inconsistencies, and integration failures.
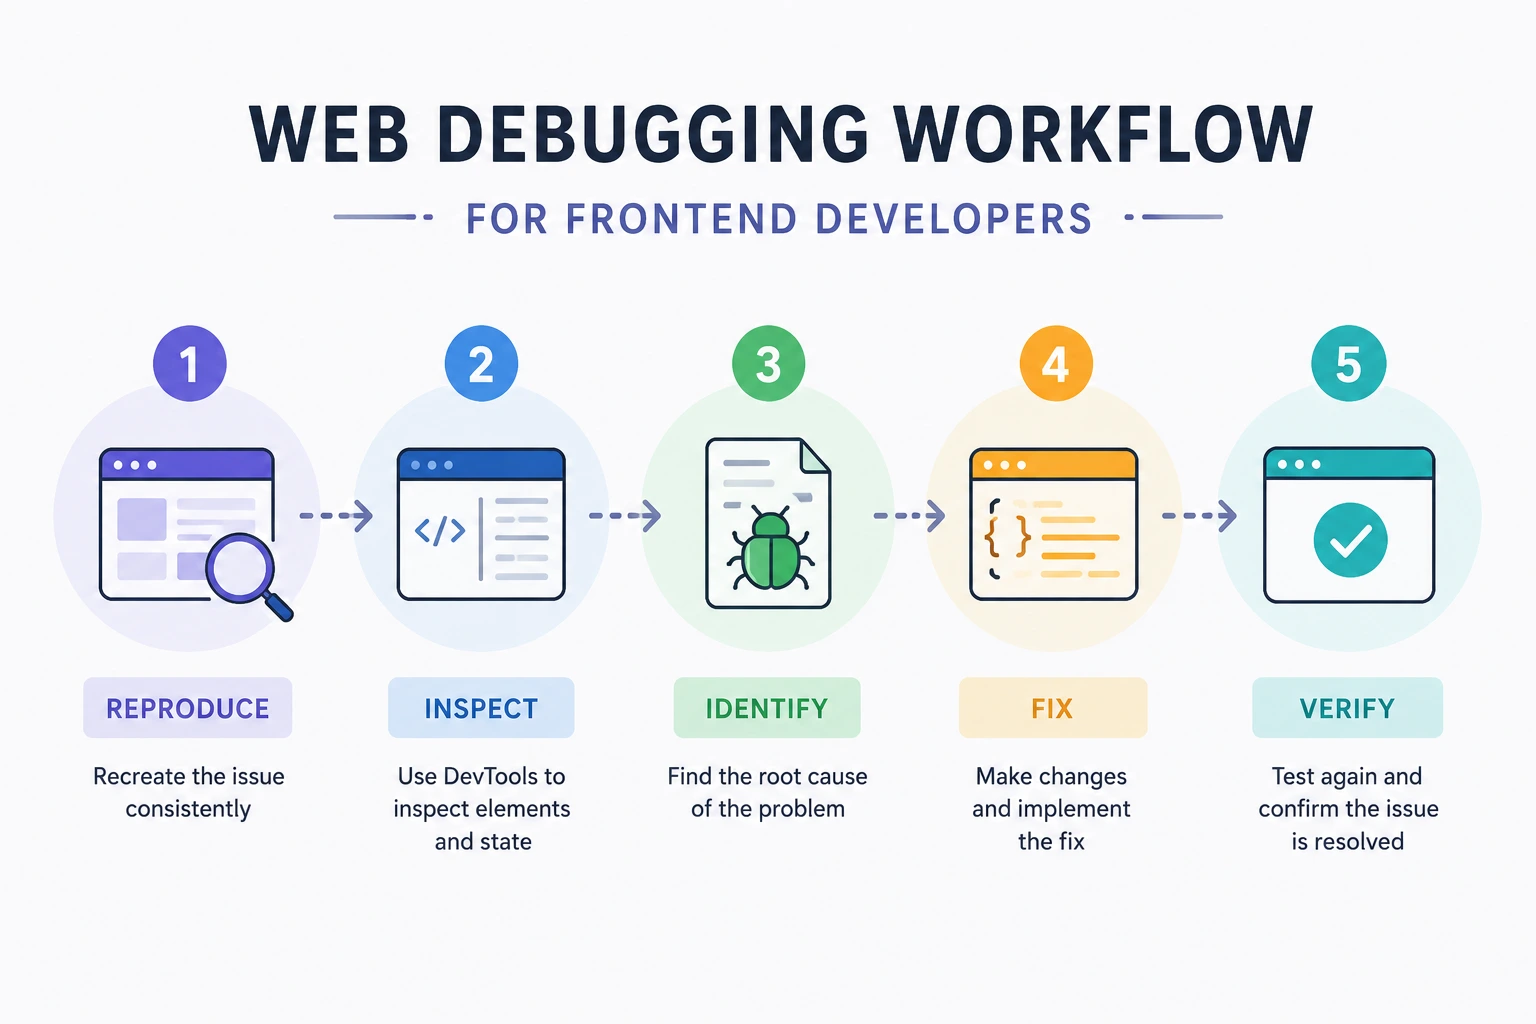
A structured Web Debugging Workflow for Frontend Developers helps teams identify, isolate, diagnose, and resolve issues efficiently. Instead of relying on trial-and-error troubleshooting, professional developers follow repeatable debugging processes that reduce downtime, accelerate development cycles, and improve software quality.
This guide outlines a comprehensive frontend debugging workflow that can be applied to websites, web applications, single-page applications (SPAs), and enterprise frontend systems.
Why Frontend Debugging Requires a Structured Workflow
Many developers approach debugging reactively.
A bug appears, and they immediately start changing code.
This often creates additional problems and increases troubleshooting time.
Benefits of a Standardized Debugging Process
A professional workflow helps developers:
- Identify root causes faster
- Reduce guesswork
- Improve debugging accuracy
- Minimize production incidents
- Accelerate issue resolution
- Improve collaboration among teams
The most successful engineering organizations treat debugging as a repeatable process rather than an improvisational activity.
Common Frontend Issues Developers Encounter
Before discussing workflow steps, it is useful to understand common categories of frontend bugs.
User Interface Issues
Examples include:
- Broken layouts
- CSS conflicts
- Responsive design failures
- Alignment problems
- Visual inconsistencies
JavaScript Errors
Common examples:
- Undefined variables
- Null reference exceptions
- Event handling issues
- State management bugs
- Runtime errors
API and Network Problems
Examples include:
- Failed requests
- Authentication errors
- CORS issues
- Timeout errors
- Invalid responses
Performance Problems
Examples include:
- Slow rendering
- Memory leaks
- Excessive API calls
- Large bundle sizes
- Long loading times
Each category requires a slightly different debugging approach.
Step 1: Reproduce the Issue Consistently
The first stage of every frontend bug fixing workflow is reproducibility.
If a bug cannot be reproduced reliably, it becomes difficult to diagnose and fix.
Gather Critical Information
Collect:
- Browser version
- Device type
- Operating system
- User actions
- Error messages
- Screenshots or recordings
Create a Reproduction Checklist
Document:
- Starting page
- User actions
- Inputs provided
- Expected result
- Actual result
This information creates a reliable debugging foundation.
Step 2: Identify the Scope of the Problem
Once the issue is reproducible, determine its scope.
Ask Key Questions
Does the issue occur:
- On all browsers?
- On specific devices?
- For certain users?
- Only in production?
- Only after deployment?
Understanding scope helps narrow potential causes.
Categorize the Issue
Classify the bug as:
- UI issue
- JavaScript issue
- API issue
- Performance issue
- Accessibility issue
Accurate classification accelerates troubleshooting.
Step 3: Check Browser Console Errors
The browser console is often the fastest source of diagnostic information.
Most modern browsers provide detailed error reporting.
Information Available in the Console
Developers can identify:
- JavaScript exceptions
- Failed resource loads
- Deprecated APIs
- Warning messages
- Stack traces
Common Console Errors
Examples include:
Uncaught TypeErrorReferenceErrorCannot read properties of undefined
These messages frequently point directly to the root cause.
Step 4: Inspect Network Requests
Many frontend issues originate from failed API interactions.
The Network panel is one of the most important browser debugging tools.
Review Request Status Codes
Monitor:
- 200 OK
- 201 Created
- 400 Bad Request
- 401 Unauthorized
- 403 Forbidden
- 404 Not Found
- 500 Server Error
Validate Request Data
Inspect:
- Request headers
- Response headers
- Query parameters
- Request payloads
- API responses
Network analysis often reveals issues unrelated to frontend code.
Step 5: Analyze the DOM and CSS
Visual issues usually require inspection of rendered elements.
The Elements panel provides visibility into the live DOM structure.
Inspect CSS Rules
Review:
- Applied styles
- Inherited styles
- Overridden rules
- Media queries
Common Layout Problems
Examples include:
- Incorrect positioning
- Overflow issues
- Z-index conflicts
- Flexbox misconfiguration
- Grid layout errors
DOM inspection remains a core component of frontend debugging techniques.
Step 6: Verify JavaScript Execution Flow
Frontend applications often involve complex execution paths.
Developers must confirm code behaves as expected.
Use Breakpoints
Breakpoints pause execution at specific locations.
Benefits include:
- Variable inspection
- State analysis
- Logic verification
- Function tracing
Examine Runtime Values
Inspect:
- Function parameters
- Return values
- Object properties
- State variables
This process helps identify logical errors quickly.
Step 7: Debug Asynchronous Operations
Modern applications rely heavily on asynchronous workflows.
Examples include:
- API requests
- Timers
- Event listeners
- Promises
- Async functions
Common Problems
Developers frequently encounter:
- Race conditions
- Timing issues
- Missing callbacks
- Failed promise chains
Verification Checklist
Confirm:
- Requests complete successfully
- Responses arrive as expected
- Error handlers execute properly
- State updates occur in the correct order
Asynchronous debugging is a critical skill for modern frontend development.
Step 8: Investigate State Management
Applications built with modern frameworks often maintain complex state structures.
Examples include:
- React state
- Vue state
- Redux stores
- Context providers
State Debugging Questions
Verify:
- Is state updating correctly?
- Is stale data being rendered?
- Are components receiving expected props?
- Are state mutations occurring properly?
Many frontend bugs originate from state inconsistencies.
Step 9: Validate User Inputs
Unexpected user input frequently causes application failures.
Input Validation Checklist
Confirm:
- Required fields exist
- Data types are valid
- Length limits are enforced
- Special characters are handled
Examples include:
- Empty values
- Invalid email addresses
- Unexpected formats
Input validation reduces runtime errors significantly.
Step 10: Review Browser Compatibility
Not all browsers behave identically.
Common Compatibility Issues
Differences may exist in:
- CSS rendering
- JavaScript APIs
- Event handling
- Storage behavior
Recommended Testing Targets
Test across:
- Chrome
- Firefox
- Safari
- Edge
Cross-browser verification is essential before deployment.
Step 11: Evaluate Frontend Performance
Some bugs manifest as performance problems rather than functional failures.
A comprehensive frontend performance debugging process should include performance analysis.
Performance Metrics to Review
Monitor:
- Page load time
- First Contentful Paint
- Largest Contentful Paint
- JavaScript execution time
- Layout shifts
Common Performance Issues
Examples include:
- Large bundles
- Excessive re-renders
- Unoptimized images
- Inefficient API calls
Performance debugging improves both usability and search visibility.
Step 12: Check Application Storage
Many applications rely on browser storage.
Developers should inspect:
- Local Storage
- Session Storage
- Cookies
- IndexedDB
Common Storage Issues
Examples include:
- Missing authentication tokens
- Expired sessions
- Incorrect cached values
Storage validation often uncovers hidden application problems.
Step 13: Investigate Memory Leaks
Memory leaks can gradually degrade application performance.
Symptoms include:
- Increased memory usage
- Browser slowdowns
- Crashes during extended sessions
Memory Debugging Checklist
Inspect:
- Detached DOM nodes
- Event listener accumulation
- Retained objects
- Unreleased resources
Long-running applications benefit significantly from memory analysis.
Step 14: Test Error Handling
Applications should fail gracefully.
Verify Error Scenarios
Test:
- Failed API requests
- Invalid user inputs
- Missing resources
- Authentication failures
Review User Experience
Ensure:
- Clear messages appear
- Recovery paths exist
- Critical information is logged
Effective error handling improves reliability and maintainability.
Step 15: Confirm the Fix
Many developers stop debugging after the issue appears resolved.
This is a mistake.
Validation Checklist
Verify:
- Original issue is fixed
- Related features still work
- No regressions exist
- Automated tests pass
Comprehensive validation ensures long-term stability.
Essential Browser Debugging Tools
Professional developers should become proficient with modern debugging utilities.
Chrome DevTools
Provides:
- Console debugging
- Network analysis
- Performance profiling
- Memory inspection
Firefox Developer Tools
Offers advanced debugging and accessibility features.
Lighthouse
Useful for:
- Performance auditing
- Accessibility analysis
- SEO evaluation
Source Maps
Source maps simplify debugging of:
- Minified code
- Bundled applications
- Production builds
These tools form the foundation of an effective Chrome DevTools debugging workflow.
Common Debugging Mistakes
Many developers inadvertently extend troubleshooting time.
Mistakes to Avoid
- Changing multiple variables simultaneously
- Ignoring console errors
- Skipping reproduction steps
- Debugging without data
- Assuming the root cause
- Neglecting performance analysis
Structured debugging minimizes these risks.
Building a Repeatable Web Debugging Workflow
A professional debugging process typically follows this sequence:
Step 1
Reproduce the issue.
Step 2
Define scope.
Step 3
Inspect console errors.
Step 4
Analyze network activity.
Step 5
Inspect DOM and CSS.
Step 6
Trace JavaScript execution.
Step 7
Verify application state.
Step 8
Evaluate performance.
Step 9
Implement and test fixes.
Step 10
Validate results.
This systematic workflow improves consistency across development teams.
Best Practices for Frontend Debugging
Organizations should establish debugging standards.
Recommended Practices
- Maintain detailed logs
- Use source control effectively
- Create reproducible test cases
- Monitor production systems
- Automate regression testing
- Document recurring issues
These practices reduce operational risk and improve engineering efficiency.
Conclusion
A structured Web Debugging Workflow for Frontend Developers transforms troubleshooting from a reactive process into a disciplined engineering practice. By systematically reproducing issues, analyzing console errors, inspecting network activity, validating state management, reviewing performance metrics, and confirming fixes, developers can identify root causes faster and resolve problems with greater confidence.
Successful frontend debugging is not merely about finding bugs. It is about understanding application behavior, validating assumptions, and maintaining high-quality user experiences across browsers, devices, and environments.
Executive Summary
Modern frontend applications are increasingly complex, making a standardized debugging process essential for maintaining performance, reliability, and scalability. The most effective developers leverage browser debugging tools, JavaScript debugging best practices, performance profiling, and structured troubleshooting workflows to diagnose issues efficiently and prevent recurring failures.
Business CTA: Implement a documented web debugging workflow across your development team and integrate debugging standards into your engineering processes. A consistent approach to troubleshooting will reduce resolution times, improve software quality, and help your organization deliver more reliable web applications at scale.
Try Next
Other utilities you might find helpful
Regex Tester
Test and debug regular expressions with live matches.
Regex Debugger
Understand regex step-by-step with explanations.
JSON Formatter
Format, validate, and minify JSON instantly.
Base64 Encoder/Decoder
Encode and decode Base64 strings and files.
SQL Explain Parser
Analyze SQL execution plans and optimize queries.
DOM Complexity Analyzer
Analyze HTML DOM structure, detect deep nesting, count nodes, and identify performance issues instantly.