
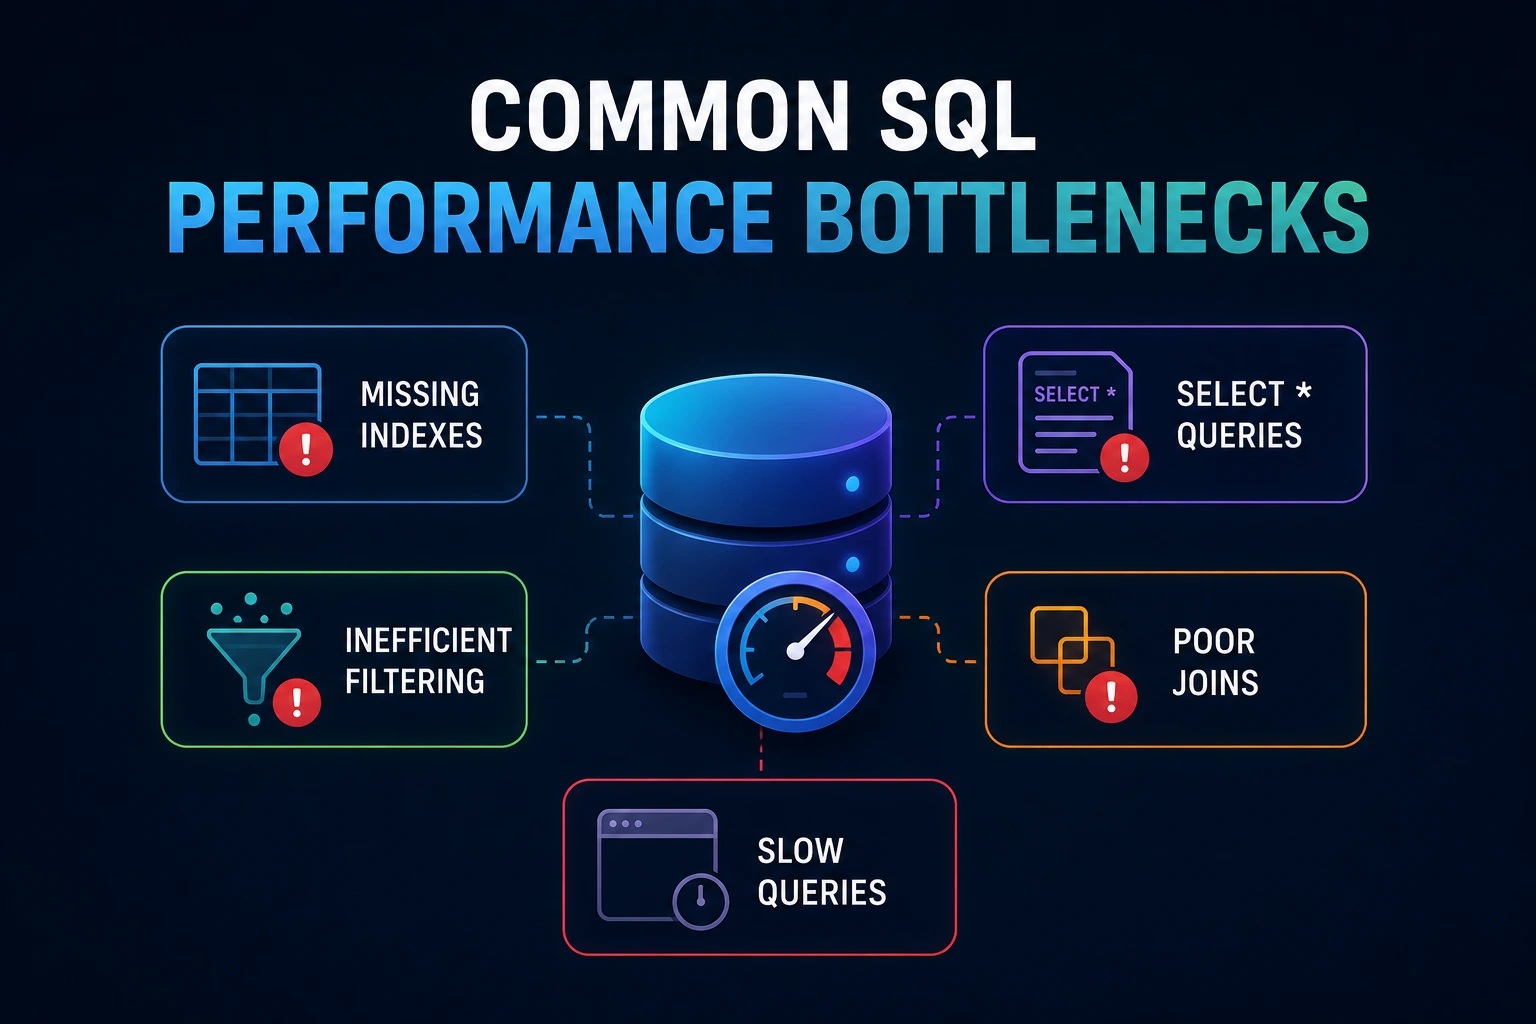
Common SQL Performance Bottlenecks
A slow database request is not always caused by one badly written query.
The delay may come from:
- Missing or unsuitable indexes
- Reading far more rows than necessary
- Incorrect optimizer estimates
- Lock contention
- Long-running transactions
- N+1 application queries
- Memory spills
- Inefficient pagination
- Hot rows
- Connection-pool exhaustion
- Storage or CPU saturation
- Network transfer
- Parameter-sensitive execution plans
Effective SQL tuning begins by determining where the time is spent.
This guide explains the most common bottlenecks, how to recognize them, and which changes are worth testing.
A SQL Bottleneck Is More Than a “Slow Query”
A query can harm a system in several ways.
High individual latency
Average execution time: 5 seconds
Calls per day: 20
This may affect a report or administrative workflow.
High cumulative cost
Average execution time: 50 milliseconds
Calls per day: 1,000,000
The second query consumes approximately 50,000 seconds of cumulative database time each day.
High concurrency impact
A query may be fast when executed alone but create lock contention or resource saturation under concurrent traffic.
High resource consumption
A query can return quickly while consuming excessive:
- CPU
- Memory
- Logical reads
- Physical reads
- Temporary storage
- Network bandwidth
Evaluate latency, frequency, resource use, and business impact together.
Establish Evidence Before Tuning
Collect:
- Normalized query text
- Representative parameters
- Average and percentile latency
- Execution count
- Total cumulative time
- Rows read
- Rows returned
- CPU time
- Logical and physical reads
- Lock and wait time
- Temporary-file usage
- Execution plan
- Relevant endpoint or job
Avoid optimizing SQL merely because it looks complicated.
A short query can be expensive. A long query can be efficient.
1. Missing or Unsuitable Indexes
Consider:
SELECT id, email, status
FROM customers
WHERE email = ?;
If the table contains millions of rows and the query regularly searches for one email address, an index may help:
CREATE INDEX idx_customers_email
    ON customers (email);
If email must be unique, the model may require a unique constraint:
CREATE UNIQUE INDEX uq_customers_email
    ON customers (email);
Before creating the index, confirm:
- Whether a similar index already exists
- Whether duplicate values exist
- Whether matching is case-sensitive
- Whether values are normalized
- Whether the query is frequent enough
- Whether added write cost is acceptable
Indexes consume storage and increase work during:
- Inserts
- Updates
- Deletes
- Bulk imports
- Backups
- Replication
- Maintenance
An index is a workload trade-off, not a free speed improvement.
2. Incorrect Composite-Index Order
Suppose this query is common:
SELECT id, created_at, total
FROM orders
WHERE customer_id = ?
  AND status = ?
ORDER BY created_at DESC
LIMIT 50;
A possible index is:
CREATE INDEX idx_orders_customer_status_created
    ON orders (
        customer_id,
        status,
        created_at
    );
Column order matters.
A composite index useful for:
customer_id + status + created_atmay not be equally useful for queries filtering only by status or only by created_at.
Choose order based on:
- Equality conditions
- Range conditions
- Sorting
- Selectivity
- Other important queries
- Database-engine behavior
Do not create every possible column combination. Use execution plans and production workload data.
3. Full Table Scans
A full scan reads every relevant row or page.
It can be expensive when:
- The table is large
- The filter is selective
- The query runs frequently
- Storage reads are required
- Few rows are returned
But a scan can be correct when:
- The table is small
- Most rows are required
- The query performs an aggregation over the complete dataset
- An index lookup would require many random reads
- No selective condition exists
- The table is already cached
Do not treat the word “scan” as proof of a bad plan.
Ask:
- How many rows were read?
- How many rows were returned?
- How much time did the scan consume?
- Was data already in memory?
- How often does the query run?
- Would an index reduce total work?
4. Non-Sargable Predicates
A predicate is commonly called sargable when the optimizer can use it efficiently as an index search condition.
Less efficient:
SELECT id, customer_id, created_at
FROM orders
WHERE YEAR(created_at) = 2026;
The function is applied to the indexed column.
A range is usually more index-friendly:
SELECT id, customer_id, created_at
FROM orders
WHERE created_at >= '2026-01-01'
  AND created_at <  '2027-01-01';
Other potentially non-sargable patterns include:
WHERE LOWER(email) = 'john@example.com'WHERE amount + 10 > 100WHERE name LIKE '%smith%'Possible solutions include:
- Rewrite the predicate
- Normalize data when storing it
- Add a supported expression or functional index
- Use full-text search for text-search requirements
- Use a search engine for advanced search behavior
Verify the plan after rewriting. Do not assume the change helped.
5. Implicit Data-Type Conversion
Joining or filtering incompatible data types can prevent efficient index use.
Example:
SELECT o.id
FROM orders AS o
JOIN customers AS c
  ON o.customer_id_text = c.id;
If one side is text and the other is numeric, the database may need to convert many values.
Other problematic comparisons include:
- Text date compared with a date type
- Unicode text joined to a different text type
- Different collations
- Signed and unsigned numeric types
- Different string lengths or semantics
Use consistent types for related keys:
customers.id           BIGINT
orders.customer_id     BIGINT
Foreign-key columns should generally match the referenced key’s type and semantics.
Fixing the schema may require a controlled migration rather than adding casts to every query.
6. Returning Too Many Rows
This query has no result limit:
SELECT id, customer_id, total, created_at
FROM orders
ORDER BY created_at DESC;
The database, network, and application may process millions of rows.
Apply a deliberate result strategy:
- Filtering
- Pagination
- Aggregation
- Streaming
- Export jobs
- Server-side report generation
Example:
SELECT id, customer_id, total, created_at
FROM orders
WHERE created_at >= ?
ORDER BY created_at DESC, id DESC
LIMIT 100;
The database still needs a suitable access path. LIMIT alone does not guarantee a fast query.
7. Selecting Unnecessary Columns
This retrieves every column:
SELECT *
FROM customers
WHERE status = 'active';
A narrower query:
SELECT id, name, email
FROM customers
WHERE status = 'active';
Possible benefits include:
- Less data read
- Less memory
- Less network transfer
- Faster serialization
- Lower application-memory use
- Better chance of a covering index
- Less coupling to schema changes
However, changing SELECT * will not fix:
- Lock waits
- Bad joins
- Missing filters
- Incorrect row estimates
- N+1 behavior
Measure the complete request.
8. Inefficient OFFSET Pagination
Traditional pagination:
SELECT id, created_at, total
FROM orders
ORDER BY created_at DESC, id DESC
LIMIT 50 OFFSET 500000;
The database may need to locate and skip a large number of rows before returning the page.
Keyset pagination uses the last item from the previous page:
SELECT id, created_at, total
FROM orders
WHERE created_at < ?
   OR (
       created_at = ?
       AND id < ?
   )
ORDER BY created_at DESC, id DESC
LIMIT 50;
A matching index might begin with:
CREATE INDEX idx_orders_created_id
    ON orders (created_at, id);
Keyset pagination works well for sequential navigation, but it does not naturally support jumping to an arbitrary page number.
Choose pagination based on product requirements.
9. Poor Join Conditions
A missing join condition can create a Cartesian product:
SELECT *
FROM orders AS o
JOIN customers AS c;
If each table has 100,000 rows, the logical result may contain billions of combinations.
Correct relationship:
SELECT
    o.id,
    o.total,
    c.name
FROM orders AS o
JOIN customers AS c
  ON c.id = o.customer_id;
Also check:
- Join-key data types
- Indexes on relevant keys
- Duplicate-producing relationships
- Filters applied after accidental row multiplication
- Unnecessary joins
- Nullable relationship behavior
Do not add DISTINCT merely to hide duplicate rows created by an incorrect join. Fix the relationship logic.
10. Large Intermediate Results
A query may return only ten rows but generate millions of intermediate rows.
Causes include:
- Many-to-many joins
- Joining before aggregation
- Duplicate-producing joins
- Broad subqueries
- Missing filters
- Large window-function partitions
- Expensive sorting
Inspect the execution plan’s row counts at each operation.
For example, aggregate before joining when that preserves the required semantics:
WITH order_totals AS (
    SELECT
        customer_id,
        SUM(total) AS lifetime_total
    FROM orders
    GROUP BY customer_id
)
SELECT
    c.id,
    c.name,
    ot.lifetime_total
FROM customers AS c
JOIN order_totals AS ot
  ON ot.customer_id = c.id;
Do not rewrite joins blindly. Modern optimizers can transform many queries, and a different written form is not automatically faster.
11. N+1 Queries
The main query may be fast while the application executes hundreds of additional queries.
Example:
$orders = Order::latest()
    ->take(100)
    ->get();

foreach ($orders as $order) {
    echo $order->customer->name;
}
If customer is loaded lazily, the application may execute:
- One query for orders
- Up to 100 customer queries
Use eager loading:
$orders = Order::query()
    ->with('customer:id,name')
    ->latest()
    ->take(100)
    ->get();
N+1 problems often do not appear as one slow statement. Detect them through:
- Query count per request
- Repeated query fingerprints
- Application tracing
- Framework development tools
- Database statement statistics
A 2-millisecond query executed 500 times is still a problem.
12. Correlated Subqueries
A correlated subquery may logically execute for each row from the outer query.
Example:
SELECT
    c.id,
    c.name,
    (
        SELECT COUNT(*)
        FROM orders AS o
        WHERE o.customer_id = c.id
    ) AS order_count
FROM customers AS c;
Depending on the database and plan, this may perform efficiently or may repeat substantial work.
A grouped join is an alternative:
SELECT
    c.id,
    c.name,
    COUNT(o.id) AS order_count
FROM customers AS c
LEFT JOIN orders AS o
  ON o.customer_id = c.id
GROUP BY c.id, c.name;
Do not assume all subqueries are slow. Optimizers can decorrelate or transform many expressions.
Compare actual plans and results.
13. Incorrect Optimizer Estimates
The optimizer estimates how many rows each step will process.
If it estimates:
10 rowsbut actually receives:
500,000 rowsit may choose a plan that performs poorly at the real scale.
Possible causes include:
- Outdated statistics
- Skewed values
- Correlated columns
- Rapid data changes
- Temporary tables without useful statistics
- Parameter-sensitive values
- Expressions that are difficult to estimate
Compare estimated and actual rows in the execution plan.
MySQL’s EXPLAIN and EXPLAIN ANALYZE provide plan information and actual timing data. MySQL also recommends refreshing table statistics when estimates contribute to poor index choices.
14. Stale or Incomplete Statistics
Statistics describe data distribution and help the optimizer estimate:
- Filter selectivity
- Join cardinality
- Range size
- Value frequency
After a major data import or distribution change, plans may become inaccurate.
Possible maintenance actions include:
MySQL:
ANALYZE TABLE orders;PostgreSQL:
ANALYZE orders;SQL Server commonly updates statistics automatically but may still require investigation for rapidly changing or skewed workloads.
Do not run maintenance commands indiscriminately during peak traffic. They can consume resources and may require privileges or operational coordination.
15. Parameter-Sensitive Plans
The same query can require different plans for different parameter values.
Example:
SELECT id, customer_id, status
FROM orders
WHERE status = ?;
If:
status = 'completed'matches 95% of rows, a scan may be appropriate.
If:
status = 'fraud_review'matches 0.01%, an index lookup may be better.
A plan created or cached for one value may perform poorly for another.
Symptoms include:
- Query is fast for some values and slow for others
- Performance changes after plan-cache events
- Actual row counts vary dramatically
- Recompilation temporarily changes performance
Solutions are engine-specific and can include:
- Better statistics
- Histograms
- Query restructuring
- Separate query paths
- Plan-management features
- Engine-supported parameter-sensitive optimization
Avoid applying hints before understanding data distribution.
16. Sorts and Hashes Spilling to Disk
Sorting, grouping, and hash joins require memory.
When an operation exceeds available working memory, the database may use temporary disk storage.
Symptoms include:
- Temporary files
- External merge sorts
- Hash batches
- Sudden latency increases
- High temporary-storage I/O
Possible causes:
- Too many rows entering the operation
- Missing useful index order
- Wide rows
- Incorrect estimates
- Insufficient per-query memory
- Excessive concurrent memory demand
Do not globally increase query memory without capacity analysis. More memory per query can reduce concurrency and cause overall memory pressure.
First reduce unnecessary rows and columns and confirm estimates.
17. Lock Contention
A query may appear slow because it is waiting for another transaction.
Example sequence:
Transaction A updates a row and remains open.
Transaction B attempts to update the same row.
Transaction B waits.
Common causes include:
- Long transactions
- User interaction inside transactions
- External API calls before commit
- Large batch updates
- Inconsistent update order
- Missing indexes during updates
- Schema changes waiting for locks
- Hot rows updated by many requests
Investigate:
- Blocking session
- Blocked session
- Locked resource
- Transaction age
- Statement being executed
- Application action that opened the transaction
A waiting query may not need rewriting. The transaction holding the lock may be the real bottleneck.
18. Long-Running Transactions
Transactions should be as short as correctness permits.
Risky application flow:
Begin transaction
Update order
Call payment API
Send email
Wait for response
Commit
The database locks may remain held while unrelated network work occurs.
Better architecture may:
- Validate input.
- Perform the required atomic database change.
- Commit.
- Dispatch asynchronous follow-up work.
- Handle external-system consistency explicitly.
The correct order depends on business and failure requirements. Do not move operations outside a transaction without considering consistency.
19. Deadlocks
A deadlock occurs when transactions wait on each other in a cycle.
Example:
Transaction A locks order 1, then requests order 2.
Transaction B locks order 2, then requests order 1.
The database detects the deadlock and aborts one transaction.
Reduce deadlock risk by:
- Updating resources in a consistent order
- Keeping transactions short
- Indexing lookup conditions
- Avoiding unnecessary locks
- Retrying aborted transactions safely
- Reducing transaction scope
Do not assume every lock timeout is a deadlock. Inspect database diagnostics.
20. Hot Rows and Hot Index Pages
Some workloads repeatedly update the same value:
UPDATE counters
SET value = value + 1
WHERE name = 'page_views';
At high concurrency, this row can serialize updates.
Other hotspots include:
- Global sequence tables
- Shared inventory rows
- Popular account balances
- Queue-head records
- Monotonically inserted index regions
Possible solutions include:
- Partitioned counters
- Append-only events
- Atomic cache counters with reconciliation
- Batching
- Queue redesign
- Reduced update frequency
- Database-specific sequence facilities
The correct approach depends on consistency requirements. Distributed counters are not automatically exact.
21. Connection-Pool Exhaustion
An API can be slow even when individual queries are fast if requests wait for a database connection.
Symptoms include:
- Long application wait before SQL starts
- Pool timeout errors
- Many idle or leaked connections
- Sudden latency during traffic spikes
- Database connection-limit exhaustion
Check:
- Pool size
- Active connections
- Idle connections
- Connection acquisition time
- Transaction duration
- Leaked connections
- Number of application instances
- Database connection capacity
Increasing the pool on every application instance can overwhelm the database. Pool size must be planned across the complete deployment.
22. CPU Saturation
High database CPU can result from:
- Large scans
- Complex expressions
- Excessive sorting
- Compression
- JSON processing
- High query frequency
- Compilation or planning
- Too much concurrency
- Missing or unsuitable indexes
Do not assume high CPU means the server needs more cores.
Identify which statements consume CPU and whether they perform useful work.
23. Storage and I/O Bottlenecks
Queries may wait for data pages, temporary files, or transaction logs.
Possible causes include:
- Working set larger than memory
- Large scans
- Poor storage latency
- Checkpoint activity
- Heavy writes
- Insufficient log throughput
- Temporary spills
- Backup activity
- Replication work
Useful measurements include:
- Physical reads
- Logical reads
- Read latency
- Write latency
- Queue depth
- Cache-hit behavior
- Temporary bytes
- Transaction-log waits
A fast storage upgrade can hide inefficient SQL temporarily, but reducing unnecessary work usually provides better long-term scalability.
24. Excessive Network Transfer
Database execution can finish quickly while the application spends time receiving and processing a large result.
Check:
- Number of rows
- Row width
- Large text or binary columns
- Compression
- Database-to-application distance
- Serialization
- Application memory
- ORM object creation
For file data, consider whether object storage is more appropriate than returning large binary values through normal application queries.
25. Index Maintenance Misconceptions
“Rebuild fragmented indexes regularly” is not a universal SQL recommendation.
Index maintenance differs substantially by engine:
SQL Server
Logical fragmentation and page density can matter for some scan-heavy workloads, but maintenance thresholds should be based on workload, index size, storage, and measured benefit.
PostgreSQL
PostgreSQL relies on VACUUM to manage dead tuples and maintain visibility information. REINDEX solves different problems and should not be treated as generic scheduled defragmentation.
MySQL InnoDB
Page splits, unused space, and table organization have engine-specific behavior. Generic rebuild schedules can create heavy I/O, locking, and replication impact.
Do not apply a maintenance script copied from another database product.
Use engine-specific evidence and documentation.
26. Unused and Duplicate Indexes
Too many indexes can increase:
- Write latency
- Storage
- Backup size
- Cache pressure
- Replication traffic
- Maintenance time
Before removing an index, check:
- Usage over a representative period
- Unique or constraint enforcement
- Foreign-key requirements
- Seasonal or monthly jobs
- Reporting workloads
- Overlap with composite indexes
- Failover and replica usage
An index with few seeks may still enforce an important constraint.
27. Inefficient Schema Design
Schema choices affect every query.
Common problems include:
- Keys stored with inconsistent types
- Unbounded text where a narrower type is appropriate
- Missing primary keys
- Missing uniqueness constraints
- Repeated comma-separated values
- Multiple concepts stored in one column
- Frequently queried attributes hidden inside large documents
- Relationships enforced only in application code
- Excessive duplication without an update strategy
Normalization can reduce inconsistency. Deliberate denormalization can reduce expensive joins for read-heavy workloads.
Neither is automatically faster. Design around:
- Correctness
- Access patterns
- Update frequency
- Data volume
- Concurrency
- Operational complexity
28. Caching the Wrong Problem
Caching can reduce query frequency, but it can also create:
- Stale data
- Invalidation complexity
- Memory pressure
- Cache stampedes
- Permission leaks
- Difficult debugging
Before caching, ask:
- Why is the query expensive?
- How frequently does its source data change?
- Can the query itself be improved?
- How stale may the result become?
- Is the result user-specific?
- How is invalidation triggered?
- What happens after cache eviction?
- Can many requests rebuild the same value simultaneously?
Cache deliberately. Do not use it to avoid understanding a broken query.
Reading an Execution Plan
Start with an estimated plan:
MySQL:
EXPLAIN
SELECT id, email
FROM customers
WHERE email = 'john@example.com';
PostgreSQL:
EXPLAIN
SELECT id, email
FROM customers
WHERE email = 'john@example.com';
Actual execution provides stronger evidence.
MySQL:
EXPLAIN ANALYZE
SELECT id, email
FROM customers
WHERE email = 'john@example.com';
PostgreSQL:
EXPLAIN (ANALYZE, BUFFERS)
SELECT id, email
FROM customers
WHERE email = 'john@example.com';
Look for:
- Estimated versus actual rows
- Rows filtered
- Loops
- Scan type
- Join type
- Sort method
- Temporary storage
- Buffers or reads
- Time per operation
- Operations consuming most total time
Warning
EXPLAIN ANALYZE executes the query. Do not run an unknown or expensive statement casually in production.
Use:
- A representative staging database
- A sanitized production copy
- An approved read replica
- A safe, bounded production query
PostgreSQL’s documentation explains how EXPLAIN ANALYZE adds actual execution statistics and how plan nodes should be interpreted.
Do Not Optimize by Estimated Cost Alone
Optimizer cost values are internal estimates. They are not milliseconds and are not directly comparable across database engines.
Focus on:
- Actual elapsed time
- Actual rows
- Actual loops
- Reads
- CPU
- Waits
- Spill behavior
- Concurrency impact
An operator with a high estimated cost may be acceptable. An underestimated operator may cause the real problem.
A Reliable Bottleneck Workflow
1. Identify the affected operation
Record the endpoint, report, job, or user workflow.
2. Capture production evidence
Collect query fingerprints, frequency, latency, and waits.
3. Rank by impact
Prioritize:
- High cumulative time
- Poor tail latency
- High resource use
- Business-critical operations
- Recent regressions
4. Separate execution from waiting
Determine whether the query is:
- Running on CPU
- Reading storage
- Waiting for a lock
- Waiting for memory
- Waiting for a connection
- Sending a large result
5. Inspect the plan
Compare estimates with actual behavior.
6. Form one hypothesis
Examples:
- Missing composite index
- Non-sargable date predicate
- N+1 application behavior
- Incorrect cardinality estimate
- Locking transaction
- Disk-based sort
7. Make one targeted change
Avoid changing SQL, indexes, server memory, and caching simultaneously.
8. Benchmark
Test with:
- Representative parameters
- Realistic data volume
- Concurrent traffic
- Warm and cold conditions
- Read and write workloads
9. Deploy gradually
Monitor:
- Latency
- CPU
- Reads
- Locks
- Error rate
- Replication delay
- Write performance
10. Keep rollback instructions
An index or rewritten query can create regressions elsewhere.
Bottleneck Checklist
Query shape
- Required rows and columns only
- Predicates are index-friendly
- Data types are compatible
- Joins express the intended relationships
- Large intermediate results are avoided
- Pagination strategy matches the use case
Indexes
- Important access paths have suitable indexes
- Composite-index order is justified
- Duplicate indexes are reviewed
- Write cost is measured
- Constraint indexes are preserved
Plans and statistics
- Estimates are compared with actual rows
- Statistics are current
- Skewed values are considered
- Parameter-sensitive behavior is tested
- Spills and repeated loops are checked
Concurrency
- Transactions are short
- Blocking is monitored
- Deadlocks are investigated
- Hot rows are identified
- Retry behavior is safe
Application
- N+1 queries are prevented
- Query count per request is monitored
- Connections are returned to the pool
- Large exports are processed appropriately
- Caching has an invalidation strategy
Operations
- Slow queries are monitored continuously
- Baselines exist
- Maintenance is engine-specific
- Production changes are measured
- Rollback procedures exist
Common SQL Performance Myths
“Every full scan is bad”
Scans can be optimal for small tables or queries returning much of a table.
“Every filtered column needs an index”
Indexes must support actual access patterns and have write and storage costs.
“Nested queries are always slower than joins”
Optimizers can transform many subqueries. Compare plans.
“LIMIT makes a query fast”
The database may still scan or sort a large dataset before applying the limit.
“Filtering earlier in written SQL always helps”
Optimizers can reorder relational operations. Query meaning and plan matter more than textual order.
“More database connections increase throughput”
Excessive concurrency can increase contention and reduce throughput.
“Rebuild every fragmented index weekly”
Maintenance is engine- and workload-specific.
“More database memory always fixes spills”
Increasing per-query memory can reduce safe concurrency.
“Caching fixes slow SQL”
Caching can hide the symptom while adding invalidation and consistency problems.
Final Thoughts
SQL performance bottlenecks are not limited to missing indexes.
The most important categories are:
- Excessive rows and columns
- Unsuitable access paths
- Incorrect optimizer estimates
- Poor join cardinality
- Application-level N+1 behavior
- Locking and long transactions
- Memory spills
- Hot resources
- Connection waits
- CPU, storage, and network limits
Begin with evidence from the real workload. Determine whether the query is executing, waiting, spilling, or transferring too much data. Then inspect the actual plan and test one targeted change.
A successful optimization is not simply a lower execution time in a development console. It is a measurable improvement in latency, throughput, and resource use under representative production traffic.
SEO recommendation: Merge this article with “How to Identify Slow SQL Queries” if both continue covering execution plans, indexes, logs, and monitoring. One comprehensive guide is more likely to perform than two pages competing for the same SQL-performance keywords.
Try Next
Other utilities you might find helpful
Regex Tester
Test and debug regular expressions with live matches.
Regex Debugger
Understand regex step-by-step with explanations.
JSON Formatter
Format, validate, and minify JSON instantly.
Base64 Encoder/Decoder
Encode and decode Base64 strings and files.
SQL Explain Parser
Analyze SQL execution plans and optimize queries.
DOM Complexity Analyzer
Analyze HTML DOM structure, detect deep nesting, count nodes, and identify performance issues instantly.